GUBELLINI DataStudio
Predict the future
GUBELLINI DataStudio is the comprehensive software suite designed to unlock the full potential of the GUBELOG-01 datalogger. From complete hardware configuration to advanced multi-agent AI analysis, the platform provides a unified "command center" for engineers, researchers, and technicians. Whether you are managing high-precision sensors or generating professional diagnostic reports, DataStudio simplifies complex data workflows into a seamless, professional experience.
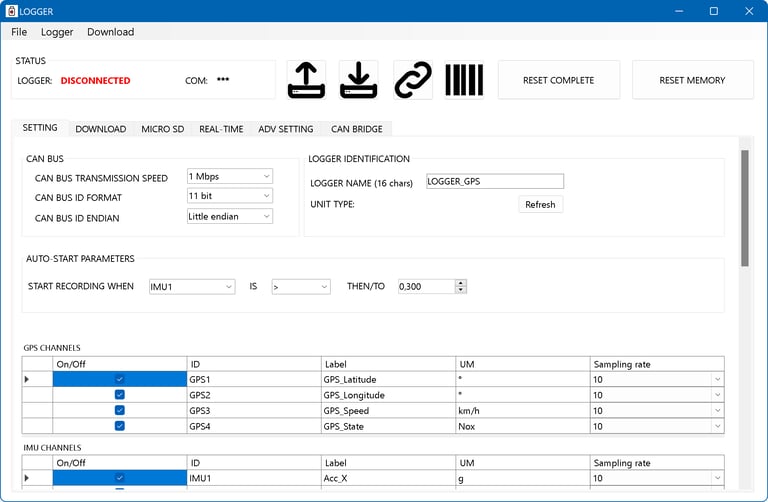
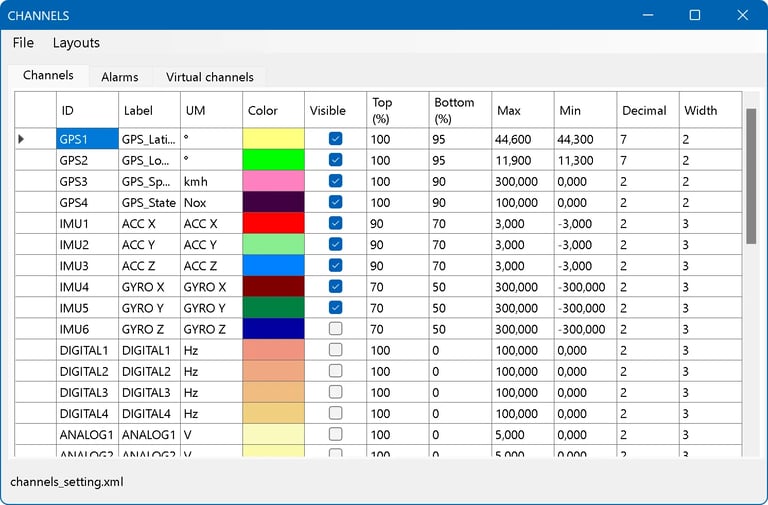
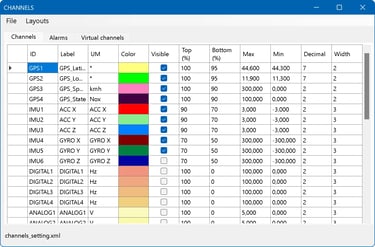
Configuration of Data Logger
The Logger module serves as the software's central hub for defining acquisition logic and device behavior. Users can activate and fine-tune all 38 simultaneous inputs, including the integrated 10Hz GPS and 6-axis IMU. The interface offers granular control over sampling rates (up to 200Hz), industrial CAN Bus protocols (such as OBD II, J1939, and ISOBUS), and programmable Auto-Start triggers.

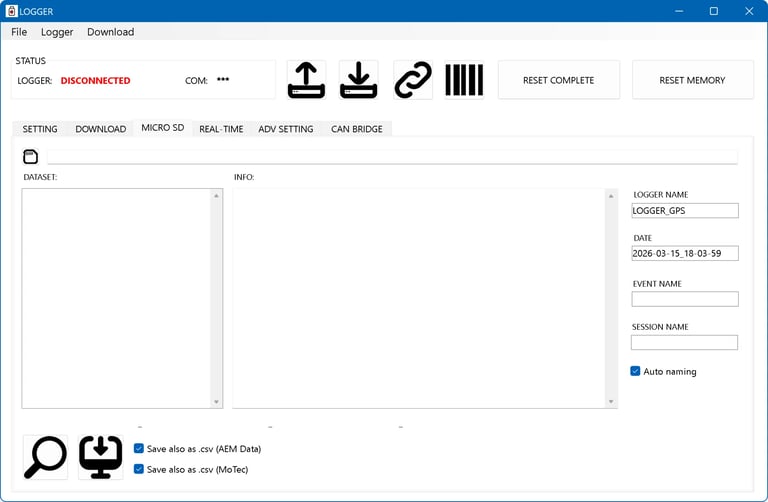
Download data
Managing your recordings is fast, flexible, and organized into intuitive datasets. The software supports standard USB-C downloads for quick access to recorded sessions directly from the device. For massive high-frequency recordings, the dedicated Micro SD function allows for "low-level raw reading". By connecting the SD card directly to your PC, you can extract gigabytes of data in seconds, bypassing serial communication limits and ensuring maximum efficiency.
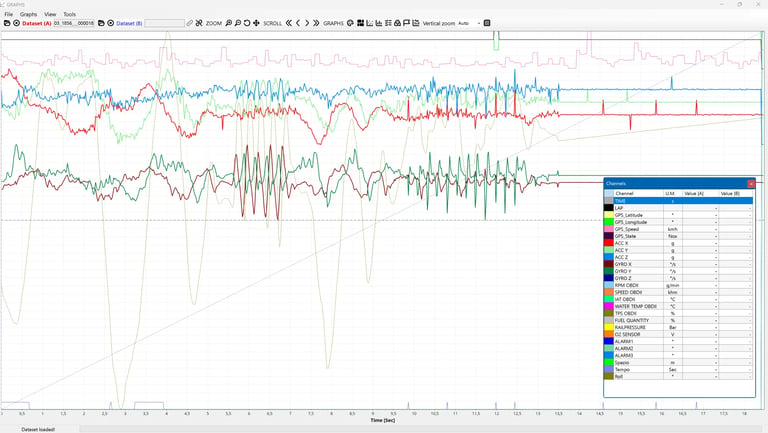
Data analysis
The Analysis suite provides high-performance visualization using dynamic TeeChart graphs designed for professional inspection. Navigate your recordings with millisecond precision using interactive cursors and real-time data grids that update instantly as you move. Beyond standard time-based charts, DataStudio includes a professional toolkit for deep analysis: Statistics (Min, Max, Avg, StdDev), XY Scatter plots for correlation studies, Histograms for frequency distribution, and FFT (Fast Fourier Transform) for advanced vibration and spectrum analysis.
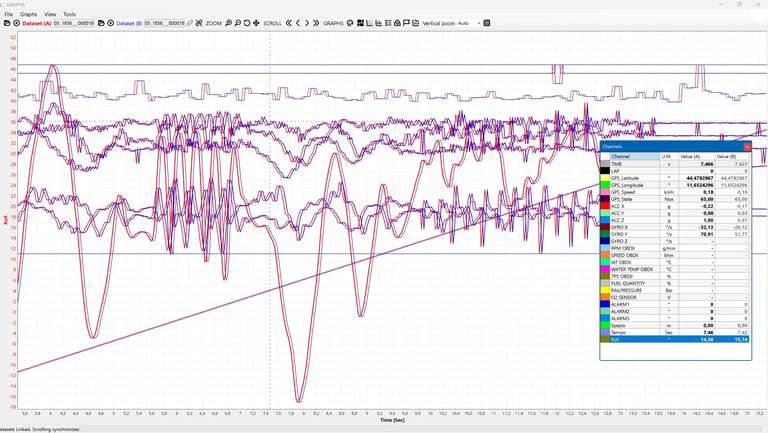
Data compare function
The Analysis suite provides high-performance visualization using dynamic graphs by which you can load 1 or 2 dataset and compare eachother. With the analisys software you can compare different laps, different sessions or different devices.
Layouts for analisys
The Analysis suite provides the ability to save layouts with a specific choice of channels, upper and lower limits, colors, line width etc. to be always available. You can switch between different layouts to run different kind of analisys. You can display always only the most significant graphs, based on what you are looking for
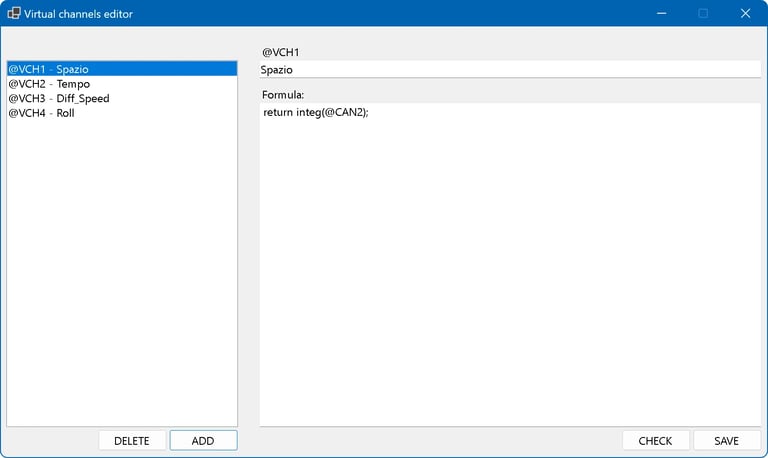
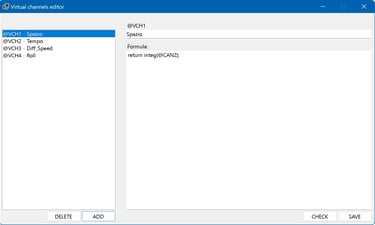
Virtual channels
The Virtual Channels module allows you to create new telemetry channels (e.g., speed, spacing, power, filters) by mathematically processing the data recorded by the Datalogger. The heart of the system is a high-performance vector calculation engine (by scripting in C#). You write the “recipe” (the script) for a single instant in time, and the software will automatically execute it at maximum speed for all the hundreds of thousands of samples recorded in the dataset.
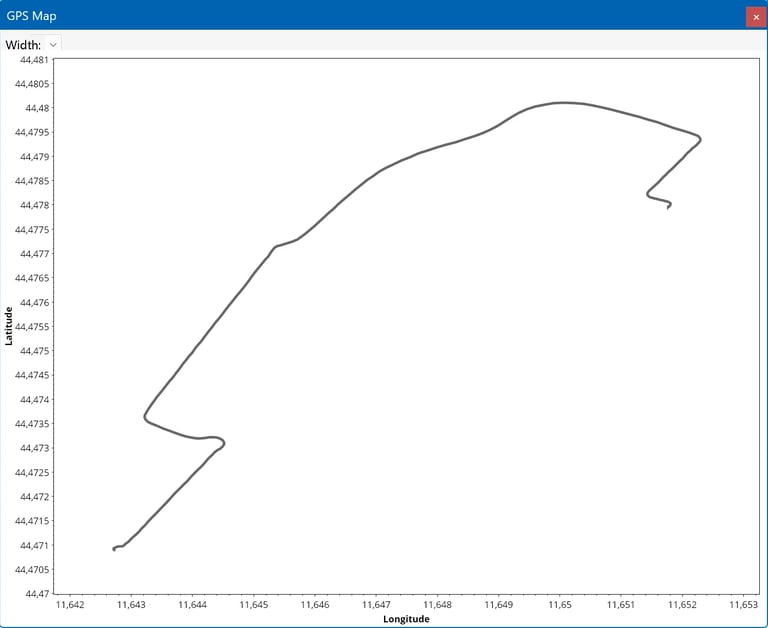
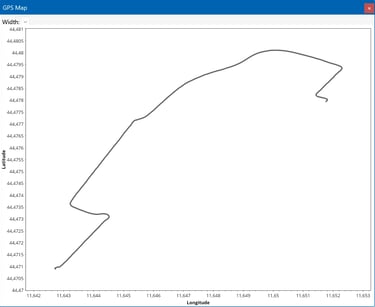
GPS Traiectory
By the GS/GNSS module, you can check the traiectory follower by the device. A simple map can be displayed and sincronized with the data to show the exact position of the device.
Advanced Diagnostic Toolkit
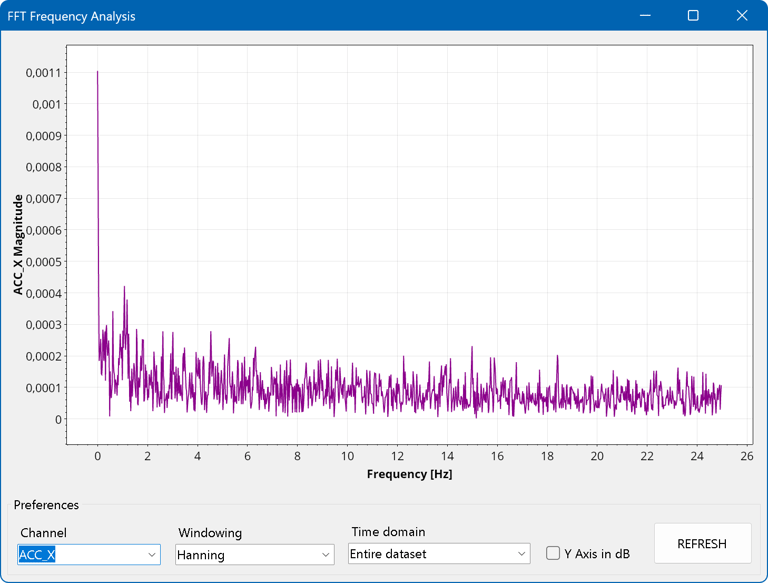
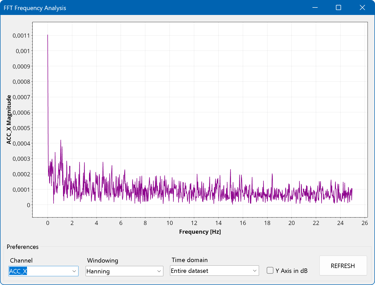
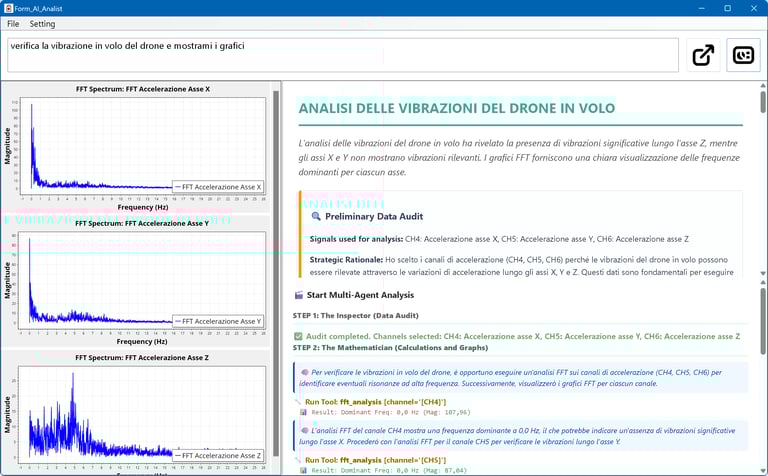
FFT (Fast Fourier Transform): This powerful spectrum analyzer decomposes complex signals into their frequency components. It is an essential tool for identifying mechanical resonances, engine chattering, or high-frequency vibrations in drones and industrial machinery that are invisible in standard graphs.
XY Scatter Plot: This module allows you to plot one channel as a function of another to perform correlation studies. It is particularly effective for visualizing physical dependencies, such as the relationship between temperature and pressure, or for analyzing hysteresis and material fatigue through stress-vs-strain cycles.
Histogram Analysis: The histogram tool provides a statistical view of your data by showing the frequency distribution of a sensor's values. It allows you to understand exactly how much time a component spent within specific critical ranges, which is ideal for creating temperature maps or monitoring activity levels in biological or mechanical systems.
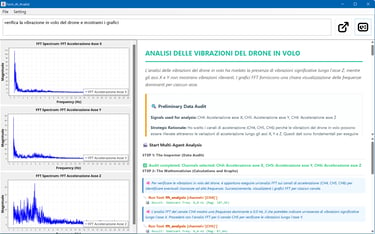
AI Analyst and automatic reports
Experience the next generation of data auditing with the AI Analyst, a sophisticated multi-agent system integrated directly into the software. Far more than a simple chatbot, the AI Analyst autonomously audits your datasets, selects relevant sensors, applies advanced mathematics (filters, integrals, FFT), and visualizes the results. By supporting leading models like Google Gemini and OpenAI, it transforms complex telemetry into professional, ready-to-share PDF reports based on your plain-language technical questions.
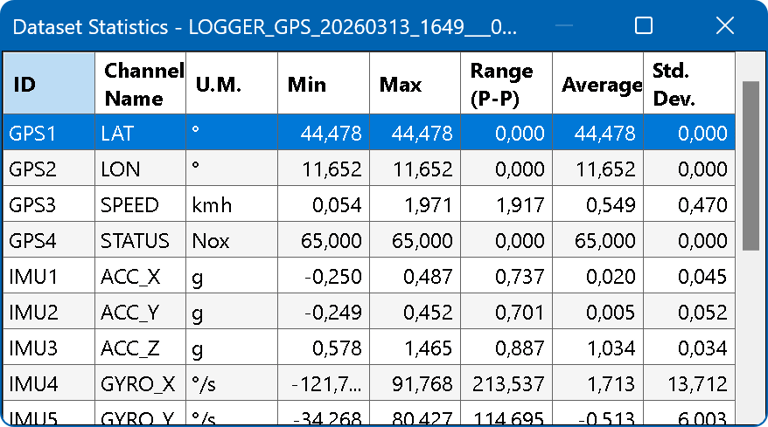
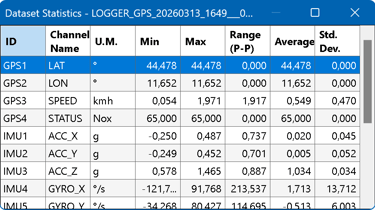
Statistic reports
Statistics table: Generates a summary table that instantly calculates the Minimum Value , Maximum Value , Range , Average and Standard Deviation for each active channel in the entire session
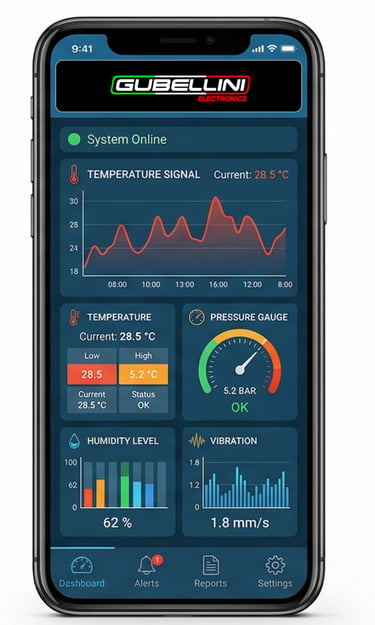
Cloud
Using the WiFi or IoT module, you can monitor all the signals recorded by the datalogger in real time. You also have the option of using a cloud service to monitor alarms and sensors remotely via a web browser or the app on your phone.

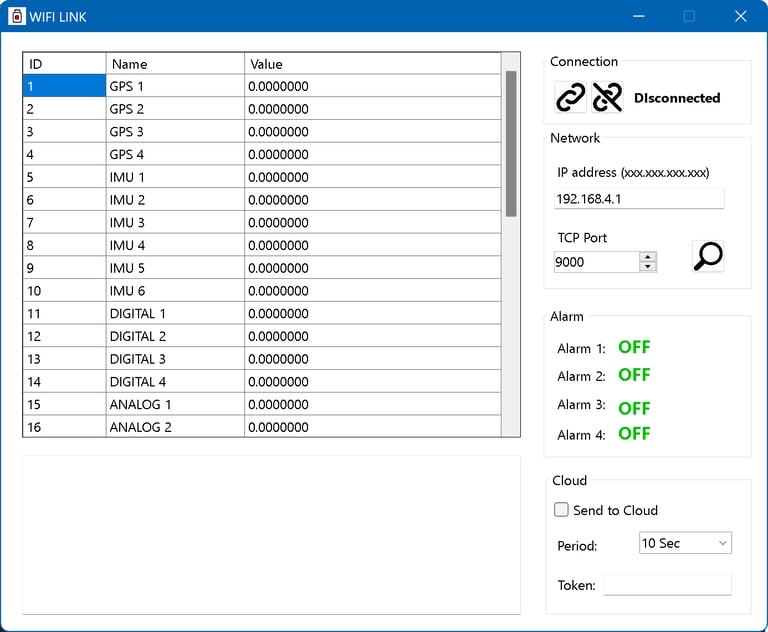
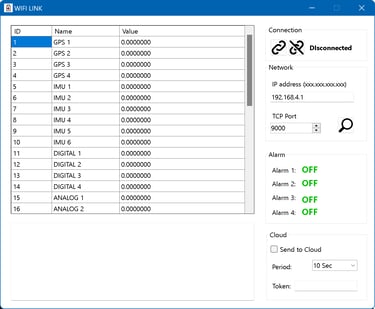
WiFi connection
Turn your PC into a real-time telemetry station with the WiFi Monitor. Once connected to the GUBELOG-01’s industrial WiFi module, you can stream all 38 channels live to your screen without cables. The software features an "Auto-Sweep" tool to instantly detect loggers on the local network and provides real-time monitoring of up to 4 programmable alarms. Additionally, integrated Cloud Bridge support enables global data accessibility via a dedicated web dashboard for remote monitoring.
Contact
PHONE
info@gubellinielectronics.com
+39 3479200208
© 2025. All rights reserved.
GUBELLINI s.a.s. di Diego Gubellini & C.
Via Euridia Bergianti 10B 40059 Medicina BO Italy
P.I. IT03466001207
+39 3801978288
POLICY
APPLICATIONS
Refund policy
Terms and conditions
COMPANY