Agrivoltaics
Optimizing Vapor Pressure Deficit (VPD) and Active Radiation (PAR) through the GUBELOG-01 Ecosystem
16 min read
Agrivoltaics : Optimizing Vapor Pressure Deficit (VPD) and Active Radiation (PAR) through the GUBELOG-01 Ecosystem
1. The Evolution of the Agrivoltaic Paradigm and the Microclimate Challenge
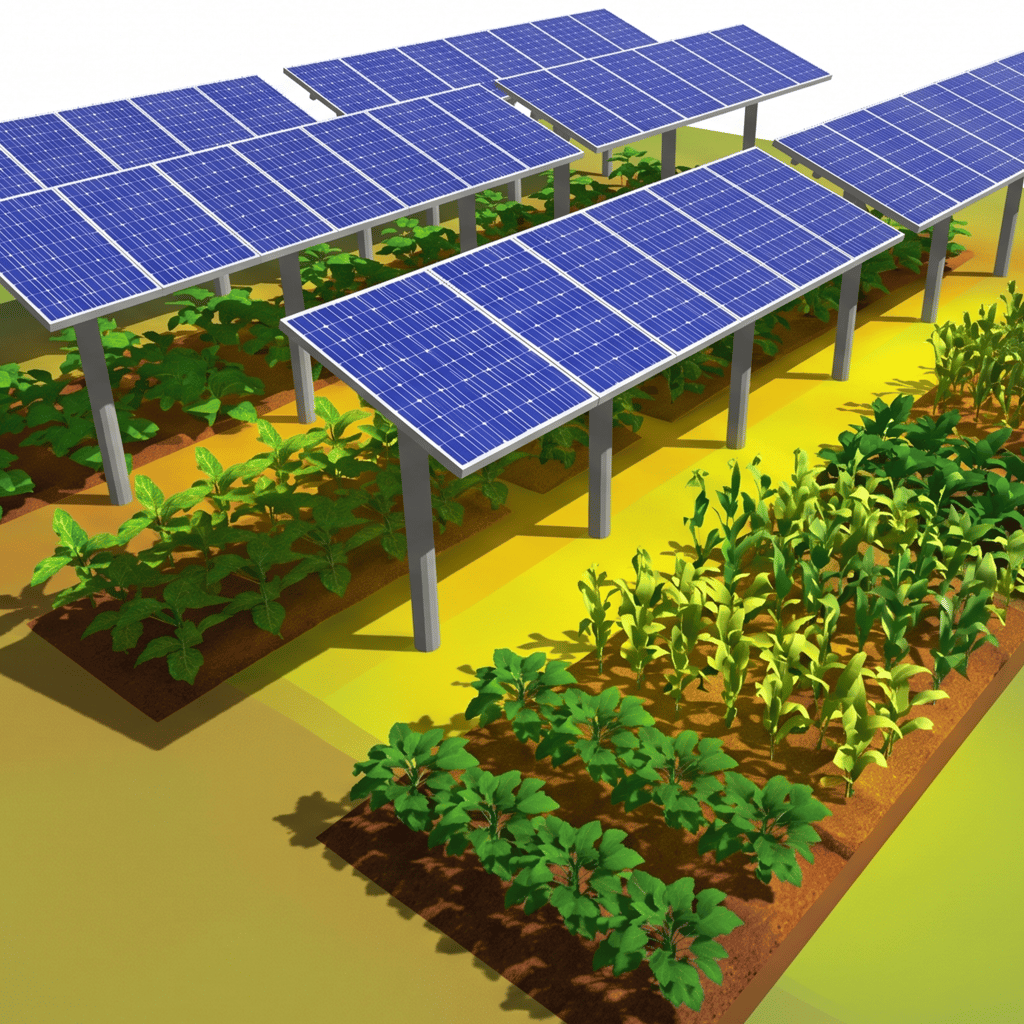
The global expansion of renewable energy infrastructure has forced a profound rethinking of land use, generating an intrinsic competition between the need to produce clean energy and the urgency of ensuring global food security. In this delicate context, agrivoltaic (APV) systems have emerged as the technological solution of choice for a synergistic and sustainable combination. These systems involve installing photovoltaic modules above agricultural crops, enabling dual use of the same plot of land and raising the Land Equivalent Ratio (LER). Research shows that, through balanced integration, overall land productivity can increase up to 70%, reaching LER values of 1.52 in configurations with tilted or solar-tracking panels.
Despite the clear macroeconomic benefits and the strong push from government incentive plans, such as the National Recovery and Resilience Plan (PNRR) in Italy, the practical implementation of agrivoltaics introduces extremely complex microclimatic changes. Photovoltaic modules act as physical shields that reduce direct solar radiation, alter precipitation distribution, modify surface albedo, and reduce the impact of wind. Empirical evidence indicates that solar radiation beneath the panels is reduced by between 30% and 79%, depending on the coverage density (Ground Cover Ratio), the inclination angle, and the type of materials used, such as opaque, bifacial, or semi-transparent panels. This interception of light generates a decrease in daytime air temperatures under the canopy, on average about 1.2°C lower than in the open field, and a slight increase in nighttime temperatures of about 0.5°C, creating a buffer effect that protects crops from extreme temperature variations.
These thermodynamic fluctuations directly and unequivocally impact the two most critical parameters for plant physiology and yield calculations: Photosynthetically Active Radiation (PAR ) and Vapor Pressure Deficit (VPD). A partially shaded and more humid environment can translate into a formidable advantage in arid climates, reducing water stress and doubling or tripling yields of specific horticultural crops, as demonstrated for tomatoes and chili peppers. However, in the absence of engineered monitoring and proactive management, excessive light reduction or the accumulation of stagnant moisture can inhibit photosynthesis, trigger devastating fungal diseases, and destroy the plant's agricultural viability.
It is therefore imperative to move beyond traditional, rudimentary weather stations, which lack the spatial granularity or computational capacity to decipher the sub-panel microclimate. The answer to this need is represented by the proprietary technologies developed by Gubellinielectronics . Through the use of the advanced GUBELOG-01 datalogger and a unique sensor board architecture called CAN-Click sensor , Gubellinielectronics provides agronomists and EPC (Engineering, Procurement, and Construction) developers with a complete ecosystem capable of acquiring, processing, and implementing corrective strategies in real time, solving the technical challenges of agrivoltaics at every stage of its evolution.[ 17, 17]
2. The Challenges of Agrivoltaics in the Five Phases of the Life Cycle and the Solutions Gubellinielectronics
The construction and operation of an agrivoltaic farm is not a one-off event, but rather a complex industrial process encompassing five critical phases. In each of these phases, the lack of precise data on the microclimate-plant relationship creates complexities that jeopardize the project's technical and economic feasibility. The inclusion of the GUBELOG-01 ecosystem transforms these critical issues into measurable and manageable variables.
2.1 Ideation and Design Phase
In the embryonic phase, engineers and agronomists must define the height of the supports, the spacing between the rows, the type of modules (e.g., bifacial verticals or single-axis trackers), and the selection of the most suitable plant species to tolerate the estimated shading. The historical complexity lies in the uncertainty of predictive models: CFD ( Computational Fluid Dynamics ) simulation software Fluid Dynamics) and geometric radiation models often fail to capture the true dynamics of evapotranspiration and the distribution of diffuse light, which in an agrivoltaic system contributes predominantly to photosynthesis compared to direct radiation. Designing a system "blindly" based on energy needs, ignoring the crop's thermal tolerance curves, inevitably leads to agricultural failure.
Gubellinielectronics system intervenes from the very first assessments. By installing a pilot network of GUBELOG-01 dataloggers equipped with CAN-Click sensor cards for PAR and environmental data, designers can collect an unambiguous baseline data set on site conditions. The infrastructure allows for the sizing of the "Thermal Budget" and the map of actual irradiance, enabling solar trackers to be designed so that their tracking routines not only maximize electricity production, but also position themselves in a protective configuration (e.g., "anti-stress position") during the hours of maximum sunlight, preemptively balancing light and shade.
2.2 Processing and Installation Phase
The construction of an agrivoltaic system requires the deployment of heavy equipment, pile-driving machines, and excavation operations, which cause significant soil compaction and alter water flow dynamics. From a network engineering perspective, wiring hundreds of environmental sensors across an open field spanning several hectares presents extreme challenges. Traditional analog sensors suffer from severe voltage drops along long cables and are susceptible to ground loops, electromagnetic interference induced by eddy currents generated by large photovoltaic inverters, which distort the readings of humidity or pH sensors.
Gubellinielectronics solves this complexity by implementing a distributed architecture natively based on the GUBELOG-01. By leveraging differential signal transmission over fieldbuses, the infrastructure becomes intrinsically immune to environmental electromagnetic noise. Furthermore, the data logger uses a highly reliable 26-pin automotive-grade connector. This connector is equipped with silicone gaskets ( sealing rings) and a mechanical snap-lock system that guarantees absolute IPX7 protection against water, dust, mud, and the constant vibrations generated by agricultural machinery moving between the rows, reducing hardware failure rates during and after construction work.
2.3 Operational Production Phase (Agricultural Management)
The operational phase represents the system's testing ground. The farmer must manage irrigation, nutrition, and disease prevention on a daily basis. Limited ventilation and the evapotranspiration trapped beneath the panels create micro-zones of stagnant humidity, the ideal environment for powdery mildew and downy mildew. Without real-time feedback on plant metabolism, water interventions are delayed or excessive, causing root asphyxiation or water waste.
Gubellinielectronics ecosystem , thanks to the GUBELOG-01's high-frequency sampling and the advanced processing of CAN-Click sensors , provides constant thermodynamic imaging. The system autonomously detects stress peaks, active radiation accumulation, and evaporative demand. The GUBELOG-01's digital outputs allow for the integration of relay modules (up to 60V and 1.5A) to directly and autonomously activate fertigation solenoid valves, recirculation fans, or misting systems as soon as safety parameters are breached. This transforms the system from a passive structure to a dynamic actor for precision agriculture.
2.4 Energy and Product Sales Phase
To monetize the investment, the operator must demonstrate the viability of the crop and its energy efficiency. Uncontrolled shading reduces fruit size, delays ripening, and can alter its chemical and nutritional profile, depreciating the market value of the fruit and vegetable product.
The GUBELOG-01 architecture acts as a digital notary. By permanently recording the climate history on the integrated Micro SD memory (which operates with RAW-level writing to prevent file system corruption) and tracking the evolution of the parameters on comparative graphs, it provides empirical evidence that the crops have been maintained within optimal growth ranges. This is essential for ensuring the quality of the batches for agri-food wholesalers and optimizing harvest timing.
2.5 Project Sale: Demonstration of LER and Access to Incentives
The financial success of an agrivoltaic park is closely linked to access to government funding, feed-in tariffs , and sustainability certifications. European and Italian ministerial guidelines (for example, those issued by the Ministry of Energy and Energy (MITE) and monitored by the GSE) require the installation of continuous monitoring systems that objectively certify soil fertility conservation, microclimate management, and the impact on agricultural productivity as a prerequisite for the provision of incentives. This is necessary to qualify the system as " advanced agrivoltaic ."
Using GUBELOG-01 solves this regulatory challenge. Through the advanced features of the AI Analyst module, the system automatically generates PDF reports that correlate environmental sensor data with crop resilience. These formatted, ready-to-use documents provide certification bodies and investors with tangible proof that the Land Equivalent Ratio (LER) and Water Use Efficiency (WUE) are meeting or exceeding project parameters, unlocking financing and increasing the agrivoltaic farm's bankability .
Photosynthetically Active Radiation (PAR)
To successfully engineer agronomic data, the Gubellinielectronics infrastructure primarily measures Photosynthetically Active Radiation (PAR). Unlike global solar radiation (measured by pyranometers in Watts per square meter, which includes the infrared and ultraviolet spectrum, which are thermally relevant but biologically inert for biomass production), PAR focuses exclusively on the spectral window that drives the photosynthetic engine, namely photons with wavelengths between 400 and 700 nanometers.
The fundamental agronomic parameter derived from PAR is the Photosynthetic Photon Flux Density (PPFD), whose integration over a 24-hour period provides the Daily Light Integral (DLI). The DLI represents the plant's daily "light food ration." In agrivoltaic systems , solar panels significantly reduce this ration. Light-loving crops (with high light requirements) show rapid yield drops if the DLI drops below specific thresholds , while shade-tolerant crops can thrive by exploiting the diffuse light fraction, which penetrates deeper into the plant canopy than the direct ray intercepted by the panels.
However, monitoring light alone using the CAN-Click sensor PAR board, designed exclusively by Gubellinielectronics, provides an incomplete picture of the ecosystem. Plants do not live by light alone; the photon energy absorbed to photolyze water and fix carbon depends strictly on water availability and the gas exchange dynamics between the leaf and the atmosphere. Without an adequate thermodynamic balance of the surrounding air, light energy translates into heat stress rather than carbohydrates. This is where the most important climatic factor comes into play: Vapor Pressure Deficit.
4. Thermodynamic Fundamentals: Vapor Pressure Deficit (VPD) and Transpiration
The methodological innovation introduced by Gubellinielectronics ' analytical approach consists in abandoning simple relative humidity (RH) in favor of vapor pressure deficit (VPD). In the context of protected cultivation, greenhouses, and, even more so, agrivoltaics , relative humidity is an obsolete and misleading indicator for measuring the interaction between air and crops.
Relative humidity indicates only as a percentage how close the air is to saturation at a given moment, but its capacity to hold water vapor increases exponentially with temperature. Consequently, a reading of 70% RH at 15°C describes a profoundly different atmospheric environment, in physical terms, than a 70% RH measured at 32°C.
The Vapor Pressure Deficit (VPD) resolves this ambiguity by unifying temperature and humidity into a single pressure metric, typically measured in kilopascals ( kPa ). The VPD calculates the mathematical difference between the saturated vapor pressure (the absolute maximum amount of vapor the air can hold at that specific temperature) and the actual vapor pressure.
The Mechanism of Transpiration and Physiological Stress
The VPD acts as the invisible engine that drives the plant's vital processes. Leaves lose water in the form of vapor through complex microscopic stomata, a process known as transpiration. Because the intercellular spaces within the leaf are virtually saturated with humidity (100% RH), water flows toward the less saturated outside atmosphere following a pressure gradient. This uninterrupted flow from roots to leaves regulates leaf cooling and transports essential solutes, but must operate within a very narrow thermodynamic corridor.
The GUBELOG-01 architecture defines an optimal "safety zone" between 0.8 kPa and 1.2 kPa . Outside these parameters, microclimatic changes caused by agrivoltaics have devastating consequences for the harvest:
VPD Too High (> 1.5 kPa ): The air is excessively dry. This scenario occurs in agrivoltaic farms located in semi-arid regions during hot summer winds, despite the shade provided by the panels. The pressure deficit exerts a violent "suction" on leaf water. To prevent potential cavitation of the xylem vessels (which would lead to embolism and tissue death), the plant reacts by triggering the immediate closure of the stomata. If the stomata close, vital carbon dioxide (CO2) uptake is interrupted, eliminating carbohydrate synthesis, halting crop growth, and blocking photosynthetic efficiency regardless of the amount of measured PAR radiation.
VPD Too Low (< 0.5 kPa ): The air is saturated with humidity. Under solar panels, especially in the morning or evening hours or under heavy canopy, the lack of ventilation and cooler temperatures drastically reduce the VPD. With a weak pressure gradient, the plant is physically unable to evaporate water from the leaves. This condition inhibits the "pump" action of the vascular system. Root water absorption slows abruptly, leading to lethal deficiencies of poorly mobile nutrients, such as calcium. The lack of calcium allocation to growing tissues causes malformations such as blossom -end rot in tomatoes and leaf margin burn in leafy crops ( tipburn ). Furthermore, the persistence of liquid water on plant surfaces due to the lack of atmospheric absorption creates the ideal breeding ground for spores of pathogenic fungi, downy mildew, and gray mold ( Botrytis cinerea).
Gubellinielectronics Distributed Architecture : From the Edge Node to the Datalogger
Measuring VPD and PAR in a large agrivoltaic field at centimeter- level poses daunting electronic challenges. To overcome the inefficiency of scattered sensors, Gubellinielectronics has implemented a cutting-edge, distributed and modular hardware architecture based on the synergy between the exclusive CAN-Click sensors and the data fieldbus.
5.1 The GUBELOG-01 Datalogger
The GUBELOG-01 acts as the central operating brain. In addition to the aforementioned mechanical robustness ensured by the automotive connector and IPX7 insulation rating, the logger is equipped with a Micro SD memory card for low-level writes in RAW format, which prevents common file system corruption errors in industrial embedded systems. Powered by DC voltages from 7V to 24V, it in turn provides conditioned 5V power for the connected sensor networks, eliminating the need for running secondary parallel power networks.
Auto-Start Condition function allows the datalogger to conserve memory and energy consumption by instructing it to generate a new dataset (log session) only when a relevant physical event occurs, such as exceeding a pre-set PAR radiation threshold or an anomalous increase in temperature, ignoring long night-time periods of physiological or energetic inactivity.
5.2 The Proprietary Ecosystem: CAN-Click Sensors
To capture physical quantities at the plant canopy level, Gubellinielectronics has engineered an exclusive line of sensor boards, called CAN-Click sensors , which integrate natively and seamlessly into the acquisition system. Gubellinielectronics ' approach is based on computational delocalization: the sensors are not directly connected to the central data logger with kilometers of noise-sensitive analog cables. Instead, they are mounted on a local interface board, called an "Edge Node ," placed directly between the plants and the solar panels.
For advanced monitoring of VPD and atmospheric compounds, Gubellinielectronics has developed the exclusive CAN-Click environmental sensor . This module represents the state of the art in microsystems engineering (MEMS). By eliminating legacy incandescent sensors and low-quality capacitive sensors that rapidly degrade under the constant humidity of protected crops, this module provides a suite of thermodynamic measurements with extremely high reliability and very low power consumption:
Atmospheric Pressure: Measured with an absolute resolution covering the range between 300 and 1100 hPa.[ 17, 17]
Relative Humidity: Very narrow tolerance of ± 3%, essential for calculating the subtle hygrometric fluctuations of the microclimate.
Temperature: Metrologically accurate to ±0.5°C, across a wide operating range that easily withstands harsh winters and summer heatwaves.
In addition to the thermodynamic quantities, this card integrates an advanced gas scanner (IAQ Index) capable of detecting Volatile Organic Compounds (VOC), oxidizing gases and Volatile Sulfur Compounds (VSC) on the parts per billion (ppb) scale.[17, 17] This "olfactory intelligence" allows for the constant monitoring of air quality and the early interception of emissions linked to bacterial rot or biological alterations of the closed ecosystem of agricultural soil.[17, 17]
Node " interface board , Gubellinielectronics pairs the environmental module with its own CAN-Click PAR sensor and a CAN-Click soil moisture sensor . This transforms the interface into a complete agronomic monitoring station.
5.3 Sensor Fusion and Data Bus Optimization
Gubellinielectronics solution lies in communications management. Traditional network architectures impose bandwidth limits on data transmission. Sending separate data for each sensor, repeated dozens of times per second across hundreds of nodes in the agrivoltaic farm , would inevitably lead to network saturation, unacceptable delays, and the collapse of alarm logic.
Gubellinielectronics bypasses this architectural obstacle by implementing a sophisticated hardware-level processing known as Sensor Fusion . The microcontroller on board the proprietary Edge Node digitally acquires thermodynamic parameters from the environmental sensor (via the internal bus) and instantly processes the mathematical calculation of the Vapor Pressure Deficit before transmitting it.
The logic processed by the peripheral node firmware is based on the equation managed by the powerful internal math engine:
$$VPD = 0.6108 \ cdot e ^{ \frac{17.27 \ cdot T}{T + 237.3}} \ cdot \ left (1 - \frac{RH}{100}\ right )$$
The result is a single index (the VPD expressed in kPa ) of extraordinary information density. The Edge Node then condenses the pre -calculated VPD value , the PAR radiation measurement, and the soil moisture, cleverly compacting them into a highly optimized data package.
Gubellinielectronics Origin Sensor
Acquired Data (Raw)
Data Processed and Transmitted to GUBELOG-01
CAN-Click sensor PAR
Incident photons
Active Radiation (PAR) processed
CAN-Click soil moisture sensor
Soil resistivity values
Volumetric soil moisture
CAN-Click environmental sensor
Temperature and Relative Humidity
VPD index calculated on- edge
integrated agrivoltaic monitoring .
Thanks to this advanced engineering, the GUBELOG-01 receives compact, high-value data. It is relieved of the burden of calculating exponential and logarithmic functions for each sensor in the network, allowing the logger to support large architectures without any performance degradation or loss of synchronization.
6. GUBELLINI DataStudio and the Power of Artificial Intelligence (AI Analyst)
Acquiring data at zero latency solves the hardware issue, but it burdens the agronomist with a volume of information (Big Data) that is unsustainable for traditional manual analysis. To transform terabytes of telemetry into operational decisions, the GUBELOG-01 interfaces with the proprietary GUBELLINI DataStudio software, an enterprise- class development and analysis environment .
6.1 Visual Analysis: The Graphics Engine and the Diagnostic ColorBand
In the "Analysis" module, the operator can view the chronological trend of crop dynamics under the agrivoltaic system . The software plots the VPD history using a continuous curve on the main interface.
Gubellinielectronics ' brilliant diagnostic insight lies in the application of immediate visual filters, such as the use of a ColorBand . This feature projects a semi-transparent green band directly onto the graph, physiologically anchored between the optimal values of 0.8 kPa and 1.2 kPa . This band represents the "comfort window" in which the plant maximizes Water Use Efficiency (WUE) while maintaining optimal photosynthetic rates for PAR absorption. The agronomist or plant technician, without having to mentally interpolate the thermal data, can verify at a glance whether the VPD curve falls within the green safety band. Sudden or prolonged deviations from the ColorBand instantly signal acute physiological stress or a serious lack of air circulation under the photovoltaic structures, requiring corrective action.
6.2 The AI Analyst: The Autonomous Digital Agronomist
The pinnacle of software innovation is the exclusive AI Analyst module, a multi-stage autonomous agent based on advanced generative AI models. It's not just a simple syntax analyzer, but a reasoning ecosystem capable of connecting concepts from agronomy, thermodynamics, and mechanical engineering.
To operate effectively, the AI Analyst is previously trained by the user. Through the dedicated Settings interface, the operator defines the Channel Names (e.g., assigning a specific sensor the name "Northern Sector VPD" and the description " Vital Breathability Value ") and establishes the Operating Contexts (e.g., Precision Agriculture) . Tractor or hydroponic management). This context provides the AI with the correct interpretative lenses to read the data.
The AI Analyst's logical process unfolds in three phases visible in the Debug panel:
The Inspector (Data Audit): Scans the GUBELOG-01 datasets (. dat ) to validate the presence of the necessary metrics (PAR, Humidity, Temperature), warning the user if the metadata is incomplete.
The Mathematician: This is the deep analytical phase. The AI doesn't just observe, but autonomously applies powerful mathematical engine functions, such as statistical filters or Fast Fourier Transform (FFT), to isolate anomalies, peaks, or temporal drifts. When queried about leaf growth deficiency, the agent cross-references occurrences where a low DLI (derived from the PAR sensor) occurred in conjunction with a chronically low VPD, identifying photosynthetic depression as the cause of the biomass loss.
The Editor (Report Writing): The module compiles a comprehensive and concise technical report, written in the same language used for the query, free from mere numerical abstractions. The report integrates logical deductions with the automatic generation of scatter plots (to show the direct correlations between panel shading and thermal stress reduction) and histograms. The final output can be exported natively to PDF (Export PDF) .
These automated documents are becoming the backbone of the certification of advanced agrivoltaic systems . They provide the scientific and irrefutable evidence of sustained agricultural yields required for Environmental Impact Assessment (EIA) approval and access to PNRR capital and funding, freeing management from the endless and costly manual assessments prepared by third-party consultants.
GUBECloud Platform : Continuous Telemetry and Active Interventions
Field data acquisition is of absolute value only if it guarantees global real-time supervision. Agrivoltaic parks often cover vast rural areas, where constant physical presence is prohibitive. Gubellinielectronics solves geographic isolation through the GUBECloud Service , the proprietary telemetry solution that elevates the GUBELOG-01 to an active node of the Internet of Things (IoT ).[ 17, 17]
Flexible Network Topology
The integration of the Cloud system provides a high level of architectural flexibility to accommodate the bandwidth availability of rural areas:
Stand Alone Cloud Mode: Through an optional external Wi-Fi module or the integration of an NB-IoT/LTE cellular modem, the GUBELOG-01 establishes a direct connection to Gubellinielectronics servers in Europe. The integrated industrial-grade network coprocessor manages the entire TCP/IPv4 stack internally , relieving the central datalogger unit .[17, 17] In this " fire -and- forget " mode, the system transmits telemetry packets with a programmable frequency (up to 1 time per minute), ensuring continuity even in the absence of corporate Wi-Fi networks, thanks to a global M2M SIM provided by the company that eliminates the bureaucratic complexities related to mobile operator tariff plans.[17, 17]
PC As Gateway: If a local control infrastructure exists, the GUBELOG-01 uses the GUBELLINI CloudBridge mini-software residing on a local server to route communications (default TCP port 9000), ensuring backup of both local and distributed data and eliminating sample loss during any cellular network instability.[ 17, 17]
The Control Dashboard and Emergency Management
Via the " Initial Configuration Form", the customer requests the customization of their own Dashboard accessible via Web Console or dedicated Mobile App.[ 17, 17] The data engineered by the Edge Nodes network comes to life through pre -configured widgets.
The operator visualizes VPD and PAR irradiance trends using Gauges (up to 4 physical inputs) , which instantly change color as they approach critical thresholds (e.g., approaching 1.5 kPa for VPD). Up to four Historical Graph panels , grouping up to six channels each, allow comparison of leaf temperatures with soil moisture and filtered radiation, reconstructing the historical dynamics needed to calibrate irrigation algorithms. The addition of the GPS Satellite Map allows the location of mobile machinery equipped with GUBELOG-01 operating within the solar infrastructure, to optimize spatial logistics.
But the GUBECloud is not just a passive observation tool; it is the nervous system of the entire plant. The GUBELOG-01 internally manages up to 4 Programmable Hardware Alarms (AL 1 - AL 4) , evaluating the conditional logic locally to eliminate activation latency .[ 17, 17] When the algorithm detects a prolonged anomaly — for example a pathological collapse of the VPD that triggers the risk of powdery mildew on the leaf blades — two simultaneous emergency protocols are activated:
Local Actuation: The datalogger 's digital outputs (0-5V) instantly switch the state of the relay modules (capable of withstanding drains up to 60V). This activates solenoid valves, turns on forced fans, or unblocks water pumps, actively modifying the microclimate beneath the structures before the physiological damage to the plant becomes irreversible.
Remote Notification: The GUBECloud Service sends direct Push notifications to the agronomist's Mobile App and forwards priority alert emails with a predefined text during configuration (e.g. WARNING: Critical VPD - Eastern Horticultural Sector ), ensuring total coverage of the O&M (Operations & Maintenance ) maintenance and control operations of the agrivoltaic system .[ 17, 17]
8. Conclusions
The ambitious promises of agrivoltaics , which aim to mitigate competition for land and increase the resilience of agricultural crops to climate change, clash with the severe complexity of microclimatic management. The rigorous control of Photosynthetically Active Radiation (PAR) and the thermodynamic stabilization of Vapor Pressure Deficit (VPD) inevitably determine the success or failure of the entire system, drawing the line between a virtuous high-LER infrastructure and an energy cathedral incompatible with agricultural production.
The ecosystem developed by Gubellinielectronics stands out as the only engineering solution capable of managing this complexity on an industrial scale. The distributed architecture based on the GUBELOG-01 data logger eliminates electrical bottlenecks and the vulnerability of traditional wiring in open fields. The use of CAN-Click sensor boards designed exclusively by the company introduces Sensor Fusion directly into the edge node: by fusing photon readings (PAR) with the local calculation of the VPD derived from the environmental module, compacted and pre-engineered data frames are transmitted.
DataStudio software enables the revolutionary AI Analyst technology, transforming vast raw datasets into predictive diagnostic reports and ready-to-use certifications for accessing incentive funds. Supported by the seamless connectivity and autonomous implementation guaranteed by the GUBECloud Service, the GUBELOG-01 system goes beyond being a simple meter to become the true conductor of precision agriculture under photovoltaic systems. Only by mastering the intimate interaction between plants and energy through these technologies can modern industry elevate agrivoltaics from an experimental level to one of sustainable agricultural and energy profitability.
Contact
PHONE
info@gubellinielectronics.com
+39 3479200208
© 2025. All rights reserved.
GUBELLINI s.a.s. di Diego Gubellini & C.
Via Euridia Bergianti 10B 40059 Medicina BO Italy
P.I. IT03466001207
+39 3801978288
POLICY
APPLICATIONS
Refund policy
Terms and conditions
COMPANY